Apache Kafka®️ 비용 절감 방법 및 최적의 비용 설계 안내 웨비나 | 자세히 알아보려면 지금 등록하세요
Seamless SIEM – Part 1: Osquery Event Log Aggregation and Confluent Platform
Osquery (developed by Facebook) is an open source tool used to gather audit log events from an operating system (OS). What’s unique about osquery is that it uses basic SQL commands against a relational data model that describes a device. It enables users to easily query important, low-level analytics on the OS. The SQL syntax makes it simpler for users familiar with SQL to look up OS information where it previously required knowledge of many terminal commands. The daemon that comes with osquery provides integration solutions to enable more modern techniques for publishing and searching logs for anomalous behavior.
Osquery is a powerful tool that can be used in modern security information and event management (SIEM) implementations to predict and detect anomalous behavior in real time using Confluent Platform or Confluent Cloud. For this use case, I’ll use the Confluent Platform to curate all streams of osquery traffic and send it to Apache Kafka®. Supported operating systems are Windows, macOS (OS X), CentOS, and FreeBSD. You can download/install osquery to follow along. The full working implementation is provided at the end which you can clone and modify yourself.
Predefined queries using osquery packs
If you are new to osquery, it can be difficult to determine which queries to use to begin inspecting logs. Fortunately, osquery has published a set of packs, which are prewritten queries (with descriptions) that gather events related to a specific behavioral category. The osquery packs repository includes hardware-monitoring, incident-response, it-compliance, osx-attacks, unwanted-chrome-extensions, windows-attacks, etc. I will be using a few of these packs to send logs to Confluent Platform.
Osquery logger plugins and extensions
Osquery comes with a daemon (osqueryd) that can output its log results through components called logger plugins. Users have the option to build their own osquery logger plugin and recompile the project, but most users will use the default logger plugins packaged with it.
The following logger plugins are built into osquery by default:
- Filesystem (default)
- TLS
- Syslog (for POSIX)
- Windows event log (for Windows)
- Amazon Kinesis firehose
- Kafka producer
Using Kafka Connect to capture osquery logs
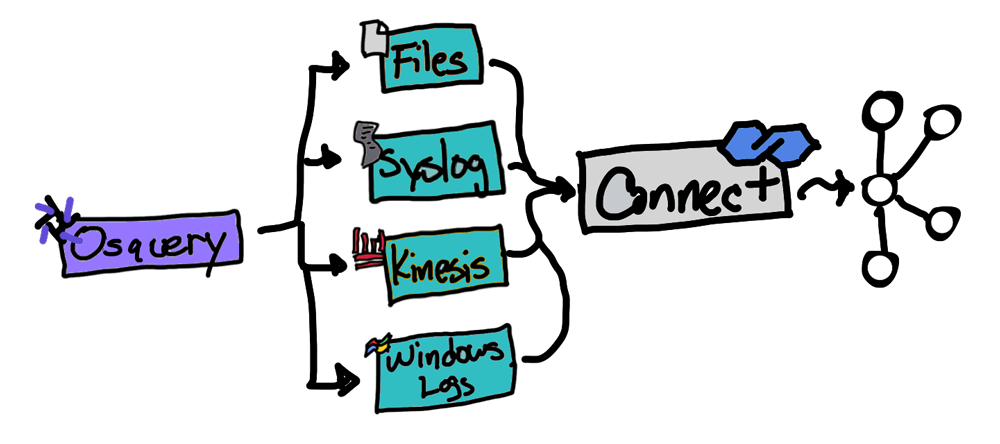
There are many ways to get osquery logs into Kafka using the prepackaged logger plugins paired with a Kafka connector from Confluent Hub. Only one of the prepackaged plugins works without a Kafka connector, and that’s the Kafka producer.
Osquery Kafka producer logger plugin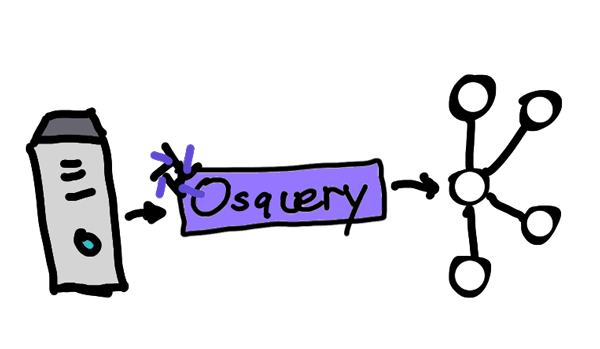
The osquery Kafka producer logger plugin is a simple way to submit logs to Apache Kafka or Confluent Platform. Since it doesn’t require a Kafka connector, there is no requirement for building a Connect cluster to simplify the architecture. However, there are limitations. It is not cloud ready and therefore cannot publish logs to Confluent Cloud. It only supports a limited set of tunable Kafka producer configurations, and several issues related to the Kafka producer have also been reported, which are well documented in the osquery GitHub repository. A better alternative is to use a custom osquery extension.
Osquery extension and librdkafka
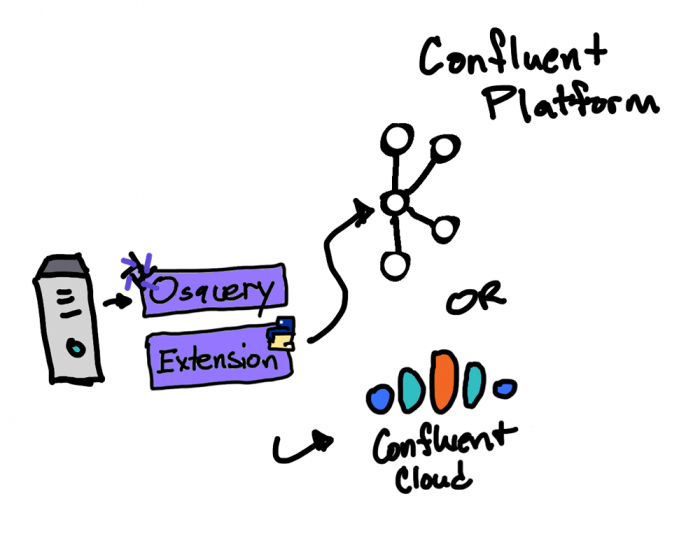
In osquery, you have the option to add a custom plugin in C++. This, however, requires a recompile of the source and may not be an option especially if the OS’s in the enterprise already have an existing osquery daemon installed and running. The extensions feature in osquery enables you to create plugins in different languages (i.e., Python) and load it into osqueryd using an Apache Thrift™ based API.
In this demonstration, I’ve written an extension in Python that uses librdkafka (the Kafka-native library for Python, C++, and .NET), which has the ability to publish osquery logs to Kafka, Confluent Platform, and Confluent Cloud without the issues and limitations that come with the prepackaged osquery Kafka producer logger plugin.
Cloud: You can easily configure the osquery Python extension to publish to Confluent Cloud just by adding the required Confluent Cloud properties. See this configuration for details.
Apache Avro™: By using librdkafka directly in your extension, you also have the option to convert the JSON messages that osquery produces into Avro and utilize Confluent Schema Registry. See GitHub for details.
Running the demo
Requirements
- Git
- Docker
- Make (only if you would like to utilize the Makefile in the repository)
- Osquery (only if you want to send logs from your local computer)
Commands
# get the code
git clone https://github.com/hdulay/demo-scene

# change directory the location which builds the Confluent Platform
cd demo-scene/osquery/cp

# build and create the Kafka cluster
make build
make up

# show the running containers
make ps

# wait 30 seconds for everything to start
Logs from host1 and host2 containers will begin sending osquery logs to Confluent Platform. You’ll see topics being created in Confluent Control Center and also have the option of running osquery locally on your host to add to the logs being generated from host1 and host2.
To send logs from your local computer, run the command below. You will need to create a similar configuration, assign it to the OSQUER_CONFIG environment variable, and pass it osqueryd.
OSQURY_CONFIG=<path-to-your-file>/cp.json osqueryd \
--extension <path-to-your-file>/confluent.ext \
--logger_plugin=confluent_logger \
--config_plugin=osquery_confluent_config
View osquery logs in Confluent Control Center
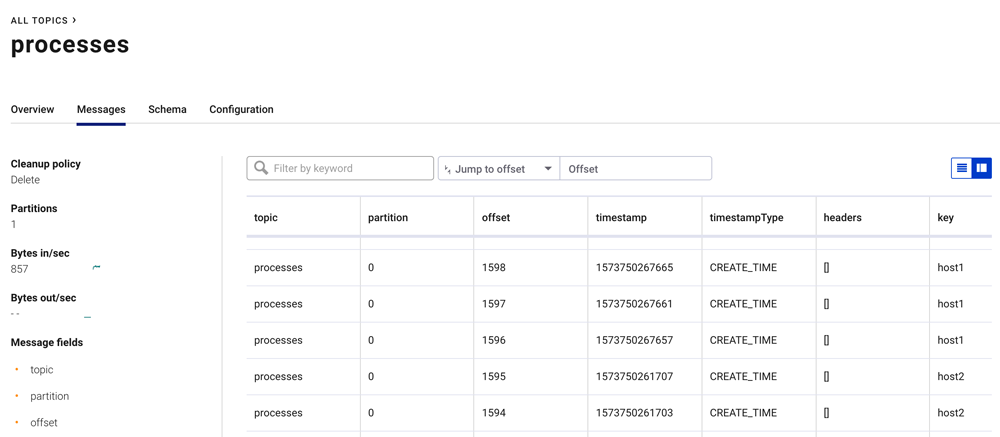
Open a browser to http://localhost:9021. This will take you to Confluent Control Center. From there, proceed to the Kafka cluster and navigate to the topics page. You will see the list of topics, most of which are being populated by osquery and the Python extension. View the messages in the processes topic, which shows the list of processes running on each host.
Creating a stream from osquery events with ksqlDB
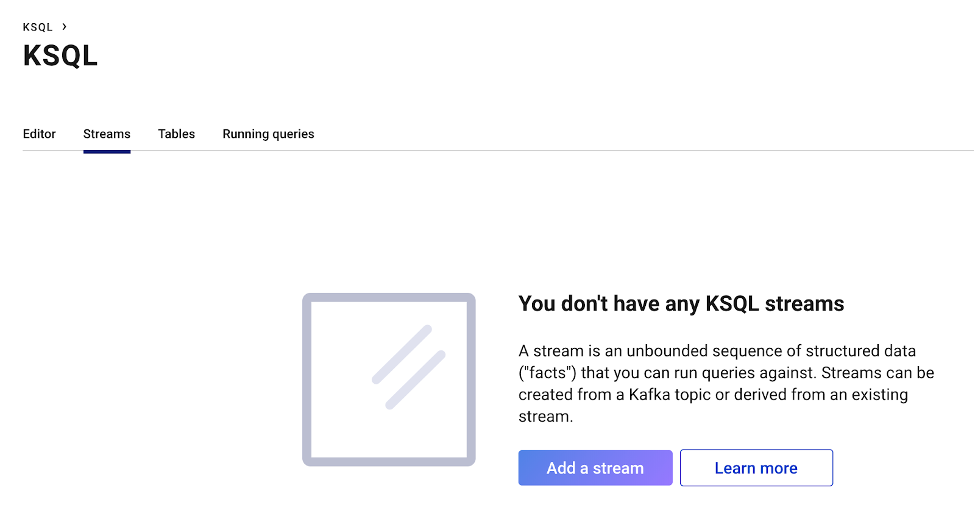
Navigate to the ksqlDB page above and create two streams from the topics processes and open_files by clicking on “Add a stream.” Select the two said topics and make sure you set “Encoding” to “JSON.” Keep the default values for the rest of the fields.
create stream proc as select hostIdentifier as host, COLUMNS['name'] as name, COLUMNS['pid'] as pid, COLUMNS['path'] as path from processes
where
COLUMNS ['name'] not like '%osqueryd%' and
COLUMNS ['name'] <> 'python' and
COLUMNS ['name'] <> 'bash';

create stream files as select  hostIdentifier as host, COLUMNS ['pid'] as pid,  COLUMNS ['path'] as path from OPEN_FILES
where
COLUMNS['path'] not like '%osquery%' and
COLUMNS['path'] not like '/proc/%' and
COLUMNS['path'] not like '/dev/%' and
len(COLUMNS['path']) <> 0;
Execute the ksqlDB commands above to create two ksqlDB streams: proc and files. These queries will transform the data to choose only the fields and records we want to see, enabling us to join these two streams by pid.
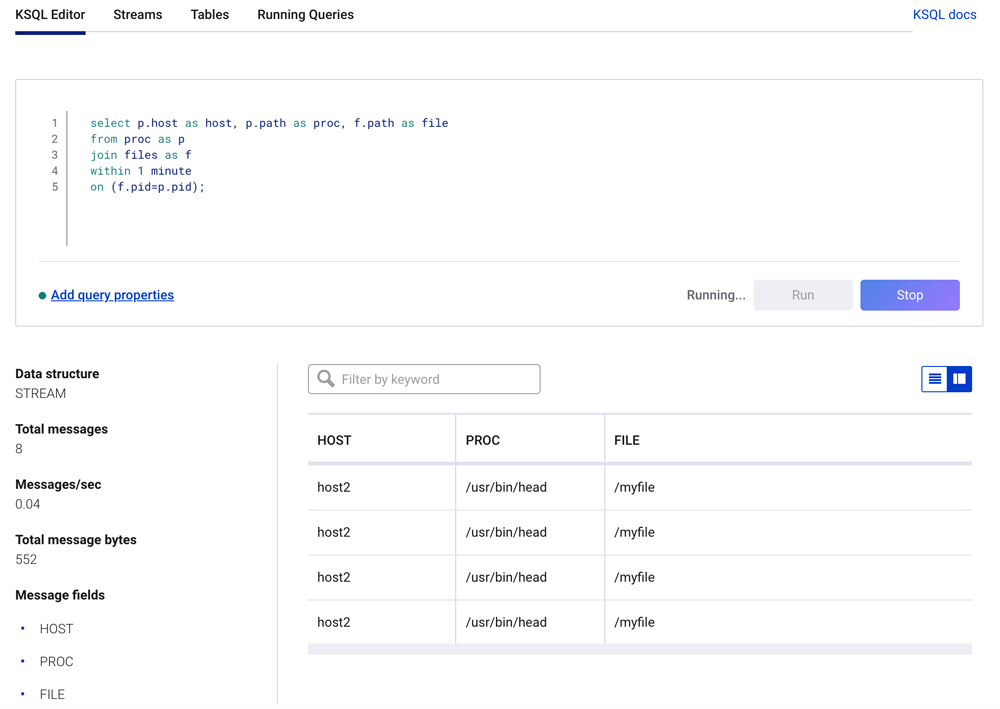
ksqlDB join
select p.host as host, p.path as proc, f.path as file
from proc as p
join files as f
within 1 minute
on (f.pid=p.pid)
emit changes;
The ksqlDB join statement above will find only records where a process has opened a file.
On host2, execute the following command to create a 1 GB file:
# login to host2
docker exec -it host2 bash

# create a 1G file
head -c 1G </dev/urandom >myfile
The results of the continuous ksqlDB join query will appear similar to what is shown below.
Recap
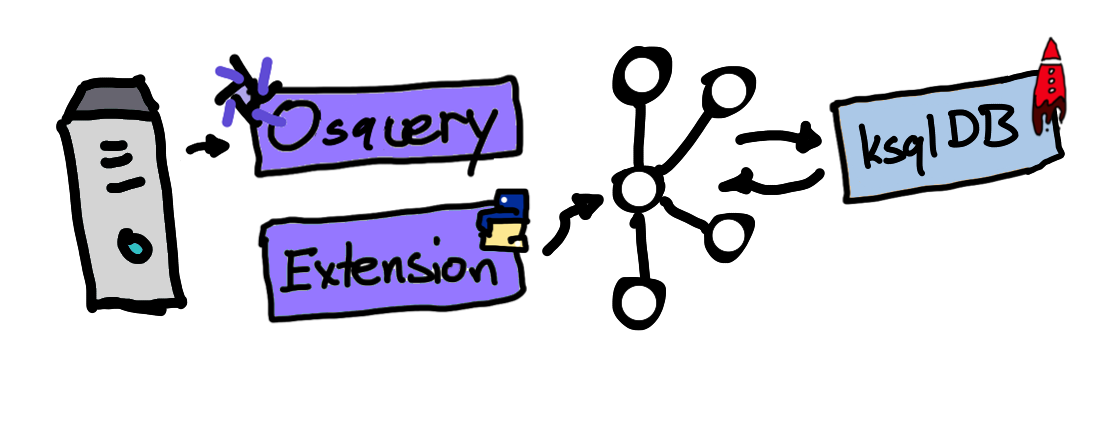 What we’ve done here is capture streams of event logs from osquery by running them as a daemon on multiple machines and publishing them to the Confluent Platform. We did this using the osquery Python extension and librdkafka, the native Kafka library for Python, Golang, .NET, and C++. We then created stream definitions in ksqlDB to join two osquery events: processes and open_files. This join captured the name of a process which opened a file and also the host on which this event occurred, ultimately providing rich context surrounding these events, which we displayed in Confluent Control Center.
Part 2 of this blog series will extend this use case to detect anomalous behaviors using machine learning. Until then, you can download the Confluent Platform to get started with a complete event streaming platform built by the original creators of Apache Kafka.
이 블로그 게시물이 마음에 드셨나요? 지금 공유해 주세요.
Confluent 블로그 구독
How to Implement Your First ML Function in Streaming
Learn how to add your first ML model to a real-time streaming pipeline. Learn a simple, low-risk pattern for inference, scoring, and deployment with Apache Kafka®.
Sustainable Streaming Architectures: A GreenOps Guide to Efficient, Low-Carbon Data Systems
Design energy-efficient, low-cost streaming systems. Learn GreenOps patterns to reduce compute waste, optimize storage, and lower the carbon footprint of real-time data.

